|
#
|
Name | Description |
|
1
|
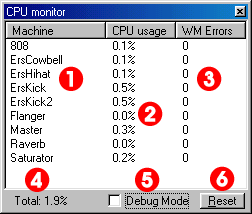
Machine Name | This indicates to which machine the current statistic refers. |
|
2
|
CPU Usage | This shows the percentage of your CPU that each machine is using. |
|
3
|
Workmode Errors | Tracks the current amount of "workmode errors" per individual machine. |
|
4
|
Total CPU | This indicates the total amount of your CPU Buzz is currently occupying. |
|
5
|
Debug Mode | This column allows developers to enable "workmode error" counting. |
|
6
|
Reset | This resets the workmode errors to 0. |