Parallel Visual3 (pV3)


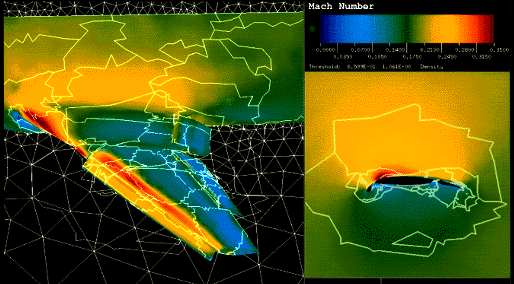
Objective: The objective of this work is to design and implement an efficient and portable system for visualization of Computational Fluid Dynamics data while it is being calculated on an MPP or across a workstation cluster. The objective is co-processing as opposed to post-processing.
Approach: The existing Visual3 flow visualization application was modified to work in two pieces. The first piece, called the server, is actually called as part of the flow solver. If the solver happens to be partitioned across an array of processors, each processor will have a pV3 server element. The server updates a data structure and awaits client requests for visualization calculations. The client runs on an SGI workstation and communicates with the server(s) using PVM. The client can attach and detach from the server(s) at will.
Accomplishment: The initial release of pV3 was installed on the NAS IBM SP-2 and used by Tim Barth to view a calculating solution. pV3 is currently available for a number of architectures including: DEC MIPS, DEC ALPHA, CONVEX, HP 9000/700s, IBM RS/6000s, KSR, SGI & SUN.
Significance: This work can be used by MPP or cluster users to view a solver as it is converging. This can be a powerful debugging tool for users who may be more used to the views created by flow visualization tools for solution analysis. This tool is unique in the ability to reintegrate and analyze data dispersed across an array of processors.
Status/Plans: This work is funded through a grant with MIT. Over the next year there are plans to port the communication portion of this package to MPI, add a capability to save extracted information at the solver for later playback, use a compatible file extract data format (this will allow interchange with FAST), work with others at this location and others to validate this approach. Points of Contact:
 Return to the Table of Contents