
Develop methods to analyze high-rate/high-volume data generated by ESS Grand Challenges.
Use virtual environments to improve dataspace navigation, provide more efficient interaction/investigation, and, through immersion, possibly improve the efficiency of neuro-optical analyses. Existing visualization software packages will be adapted to utilize virtual environment technologies.
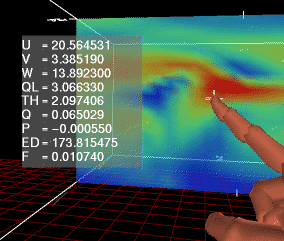
Data sonification was added to our custom version of Vis5D to improve information throughput by utilizing the sense of hearing as well as sight. Using a Crystal River Engineering Acoustetron II 3-D sound generator, a user can now "hear" data at his or her fingertip. Specifically, the numeric data value of a selected data field at the location of the virtual hand's fingertip is used to modulate the pitch of a sound (e.g., a higher data value creates a higher pitched sound). Up to seven data fields can be sonified simultaneously. Additionally, utilizing the 3-D capabilities of the sound generator, an optional auditory location beacon can be activated that indicates to the user the direction of the North (or +X) axis. This is helpful when the user is positioned deep inside the data and needs to understand the current location.

A movie (8.4 MB QuickTime
with audio) demonstrating the data sonification capability.
The field being sonified and visualized as a data slice is the U vector
component.
Data is from Bob Schlesinger's thunderstorm model included with Vis5D.
To help document investigations, scripted fly-through capabilities and geometry extraction mechanisms were added to the visualization tools to simplify the creation of visualization movies. For the fly-throughs, several key camera positions can be specified and a motion spline is generated to smoothly transition between the positions. A movie of the resulting fly-through can be automatically created. The geometry extraction capability saves the visualization to files as explicit geometry (as opposed to data grids) to be later read and used in rendering and animation packages such as Lightwave. These capabilities are being used to make a movie for ESS Investigator Peter Lyster/University of Maryland.
The procurement and installation of the new HPCC visualization workstation (a Silicon Graphics Onyx2) was completed.
Some more examples of recent work using our virtual environment version of Vis5D:

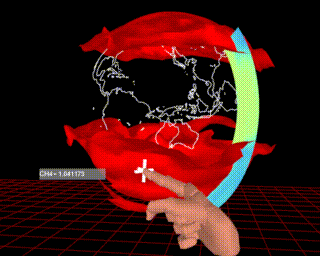
Visualization of global methane distribution using data assimilation
(data from ESS Investigator
Peter Lyster/University of Maryland).
See a movie (2.4 MB MPEG) showing wave
breaking between mid-latitudes and the polar region.
Another movie (12.1 MB MPEG)
shows the same phenomenon using a Mercator projection.

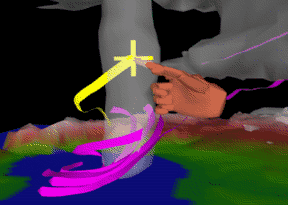
Using the virtual hand to release wind-following tracers
in a hurricane simulation
(data from the Goddard Space Flight Center Laboratory
for Atmospheres).
See a movie (2.9 MB MPEG)
of the virtual hand.
The job of the NASA scientist increasingly involves sifting through mountains of acquired and computationally generated data. The essence of VR is to deal with the data in the same way that you deal with the actual world--through the visual cortex and motor responses--rather than through artificial interfaces. The creation of an operational VR environment for rapid data searching and manipulation is required to validate the theory and transfer it to the NASA science community.
Most goals concerning the development of a virtual environment tool have been met. Focus will now shift to providing remote access to centralized graphical rendering resources such as the new HPCC visualization workstation.
Dr. Horace Mitchell
Goddard Space Flight Center
horace.mitchell@gsfc.nasa.gov
301-286-4030
Steve Maher
Goddard Space Flight Center
steve.maher@gsfc.nasa.gov
301-286-3368
Table of Contents | Section Contents -- System Software R&D | Subsection Contents -- Distributed Visualization Environments