Concepts: Key Measures of Test
Introduction 
The key measures of a test include coverage and quality.
Test coverage is the measurement of testing completeness, and is based on the coverage of testing, expressed either by the coverage of test requirements and test cases, or the coverage of executed code.
Quality is a measure is of reliability, stability, and the performance of the target-of-test (system or application-under-test). Quality is based upon the evaluation of test results and the analysis of change requests (defects) identified during the testing.
Coverage Measures

Coverage metrics provides answers to the question "How complete is the testing?" The most commonly used coverage measures are requirements-based and code-based test coverage. In brief, test coverage is any measure of completeness with respect to either a requirement (requirement-based) or the code's design / implementation criterion (code-based), such as the verification of use cases (requirement-based) or execution of all lines of code (code-based).
Any systematic testing activity is based on at least one test coverage strategy. The coverage strategy guides the design of test cases by stating the general purpose of the testing. The statement of coverage strategy can be as simple as verifying all performance.
If the requirements are completely cataloged, a requirements-based coverage strategy may be sufficient for yielding a quantifiable measure of testing completeness. For example, if all performance test requirements have been identified, then the test results can be referenced to get measures, such as 75 percent of the performance test requirements have been verified.
If code-based coverage is applied, test strategies are formulated in terms of how much of the source code has been executed by tests. This type of test coverage strategy is very important for safety-critical systems.
Both measures can be derived manually (equations given below), or may be calculated by test automation tools.
Requirements-based test coverage

Requirements-based test coverage is measured several times during the test life cycle and provides the identification of the test coverage at a milestone in the testing life cycle (such as the planned, implemented, executed, and successful test coverage).
- Test coverage is calculated by the following equation:
Test Coverage = T(p,i,x,s) / RfT
where:
T is the number of Tests (planned, implemented, executed, or successful) as expressed as test procedures or test cases.RfT is the total number of Requirements for Test.
- In the Plan Test activity, the test coverage is calculated to determine the planned test coverage and is calculated in the following manner:
Test Coverage (planned) = Tp / RfT
where:
Tp is the number of planned Tests as expressed as test procedures or test cases.RfT is the total number of Requirements for Test.
- In the Implement Test activity, as test procedures are being implemented (as test scripts), test coverage is calculated using the following equation:
Test Coverage (implemented) = Ti / RfT
where:
Ti is the number of Tests implemented as expressed by the number of test procedures or test cases for which there are corresponding test scripts.RfT is the total number of Requirements for Test.
- In the Execute Test activity, there are two test coverage measures used,
one identifies the test coverage achieved by executing the tests, while the
second identifies the successful test coverage (those tests that executed
without failures, such as defects or unexpected results).
These coverage measures are calculated by the following equations:
Test Coverage (executed) = Tx / RfT
where:
Tx is the number of Tests executed as expressed as test procedures or test cases.RfT is the total number of Requirements for Test.
Successful Test Coverage (executed) = Ts / RfT
where:
Ts is the number of Tests executed as expressed as test procedures or test cases which completed successfully and without defects.RfT is the total number of Requirements for Test.
Turning the above ratios into percentages allows the following statement of requirements-based test coverage:
x% of test cases (T(p,i,x,s) in the above equations) have been covered with a success rate of y%
This is a meaningful statement of test coverage that can be matched against a defined success criteria. If the criteria have not been met, then the statement provides a basis for predicting how much testing effort remains.
Code-based test coverage 
Code-based test coverage measures how much code has been executed during the test, compared to how much code there is left to execute. Code coverage can either be based on control flows (statement, branch, or paths) or data flows. In control-flow coverage, the aim is to test lines of code, branch conditions, paths through the code, or other elements of the software's flow of control. In data-flow coverage, the aim is to test that data states remain valid through the operation of the software, for example, that a data element is defined before it is used.
Code-based test coverage is calculated by the following equation:
Test Coverage = Ie / TIic
where:
Ie is the number of items executed expressed as code statements, code branches, code paths, data state decision points, or data element names.
TIic is the total number of items in the code.
Turning this ratio into a percentage allows the following statement of code-based test coverage:
x% of test cases (I in the above equation) have been covered with a success rate of y%
This is a meaningful statement of test coverage that can be matched against a defined success criteria. If the criteria have not been met, then the statement provides a basis for predicting how much testing effort remains.
Quality Measures

While the evaluation of test coverage provides the measure of testing completion, an evaluation of defects discovered during testing provides the best indication of software quality. Quality is the indication of how well the software meets the requirements, so in this context, defects are identified as a type of change request in which the target-of-test failed to meet the requirements.
Defect evaluation may be based on methods that range from simple defect counts to rigorous statistical modeling.
Rigorous evaluation uses assumptions about the arrival or discovery rates of defects during the testing process. A common model assumes that the rate follows a Poisson distribution. The actual data about defect rates are then fit to the model. The resulting evaluation estimates the current software reliability and predicts how the reliability will grow if testing and defect removal continue. This evaluation is described as software-reliability growth modeling and is an area of active study. Due to the lack of tool support for this type of evaluation, you should carefully balance the cost of doing it with the value it adds.
Defects analysis means to analyze the distribution of defects over the values of one or more the parameters associated with a defect. Defect analysis provides an indication of the reliability of the software.
For defect analysis, there are four main defect parameters commonly used:
- Status the current state of the defect (open, being fixed, closed, etc.).
- Priority the relative importance of this defect having to be addressed and resolved.
- Severity the relative impact of this defect. The impact to the end-user, an organization, third parties, etc.
- Source where and what is the originating fault that results in this defect, or what component will be fixed to eliminate the defect.
Defect counts can be reported as a function of time, creating a Defect
Trend diagram or report, defect counts can be reported as a
function of one or more defect parameters, like severity or status, in a Defect
Density report. These types of analysis provide a perspective on
the trends or distribution of defects that reveal the software's reliability,
respectively.
For example, it is expected that defect discovery rates will eventually diminish
as the testing and fixing progresses. A threshold can be established below which
the software can be deployed. Defect counts can also be reported based on the
origin in the implementation model, allowing detection of "weak
modules", "hot spots", parts of the software that keep being
fixed again and again, indicating some more fundamental design flaw.
Defects included in an analysis of this kind have to be confirmed defects. Not all reported defects report an actual flaw, as some may be enhancement requests, out of the scope of the project, or describe an already reported defect. However, there is value to looking at and analyzing why there are many defects being reported that are either duplicates or not confirmed defects.
Defect Reports 
The Rational Unified Process provides defect evaluation in the form of three classes of reports:
- Defect distribution (density) reports allow defect counts to be shown as a function of one or two defect parameters.
- Defect age reports are a special type of defect distribution report. Defect age reports show how long a defect has been in a particular state, such as Open. In any age category, defects can also be sorted by another attribute, like Owner.
- Defect trend reports show defect counts, by status (new, open, or closed), as a function of time. The trend reports can be cumulative or non-cumulative.
- Test results and progress reports show the results of test procedure execution over a number of iterations and test cycles for the application-under-test.
Many of these reports are valuable in assessing software quality. The usual test criteria include a statement about the allowable numbers of open defects in particular categories, such as severity class. This criterion is easily checked with a defect distribution evaluation. By filtering or sorting on test requirements, this evaluation can be focused on different sets of requirements.
To be effective producing reports of this kind normally requires tool support.
Defect Density Reports 
Defect Status Versus Priority
Each defect should be given a priority; usually it is practical to have four priority levels:
- Resolve immediately
- High priority
- Normal queue
- Low priority
Criteria for a successful test could be expressed in terms of how the distribution of defects over these priority levels should look. For example, to a successful test criteria might be no Priority 1 defects and fewer than five Priority 2 defects are open. A defect distribution diagram, such as the following, should be generated:
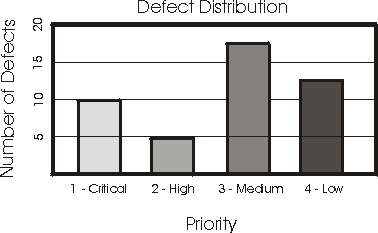
It is clear that the criterion has not been met. Note that this diagram needs to include a filter to show only open defects as required by the test criterion.
Defect Status Versus Severity
Defect severity reports show how many defects there are of each severity class (for example: fatal error, major function not performed, minor annoyance).
Defect Status Versus Location in the Implementation Model
Defect source reports show distribution of defects on elements in the implementation model.
Defect Aging Reports 
Defect age analyses provide good feedback on the effectiveness of the testing and the defect removal activities. For example, if the majority of older, unresolved defects are in a pending-validation state, it probably means that not enough resources are applied to the re-testing effort.
Defect Trend Reports 
Trend reports identify defect rates and provide a particularly good view of the state of the testing. Defect trends follow a fairly predictable pattern in a testing cycle. Early in the cycle, the defect rates rise quickly. Then they reach a peak and fall at a slower rate over time.
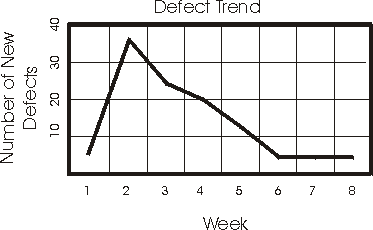
To find problems, the project schedule can be reviewed in light of this trend. For example, if the defect rates are still rising in the third week of a four-week test cycle, the project is clearly not on schedule.
This simple trend analysis assumes that defects are being fixed promptly and that the fixes are being tested in subsequent builds, so that the rate of closing defects should follow the same profile as the rate of finding defects. When this does not happen, it indicates a problem with the defect-resolution process; the defect fixing resources or the resources to re-test and validate fixes might be inadequate.
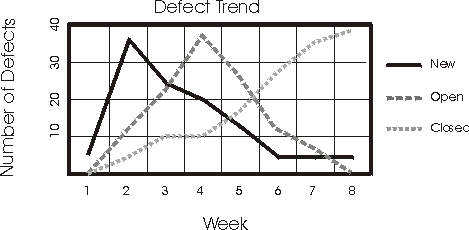
The trend reflected in this report shows that new defects are discovered and
opened quickly at the beginning of the project, and that they decrease over
time. The trend for open defects is similar to that for new defects, but lags
slightly behind. The trend for closing defects increases over time as open
defects are fixed and verified. These trends depict a successful effort.
If your trends deviate dramatically from these, they may indicate a problem and
identify when additional resources may need to be applied to specific areas of
development or testing.
When combined with the measures of test coverage, the defect analyses provide a very good assessment on which to base the test completion criteria.
Performance Measures 
Several measures are used for assessing the performance behaviors of the target-of-test and focus on capturing data related to behaviors such as response time, timing profiles, execution flow, operational reliability and limits. Primarily, these measures are assessed in the Evaluate Test activity, however, there are performance measures that are used during the Execute Test activity to evaluate test progress and status.
The primary performance measures include:
- Dynamic monitoring - real-time capturing and display of the status and state of each test script being executed during the test execution.
- Response Time / Throughput - measurement of the response times or throughput of the target-of-test for specified actors, and / or use cases.
- Percentile Reports - percentile measurement / calculation of the data collected values.
- Comparison Reports - differences or trends between two (or more) sets of data representing different test executions.
- Trace Reports - details of the messages / conversations between the actor (test script) and the target-of-test.
Dynamic Monitoring 
Dynamic monitoring provides real-time display / reporting, typically in the
form of a histogram or graph. The report is used to monitor or assess
performance test execution during test execution by displaying the current
state, status, and progress the test scripts being executed.
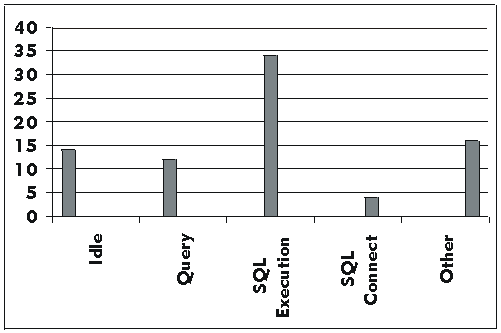
For example, in the above histogram, we have 80 test scripts executing the same use case. In this display, 14 test scripts are in the Idle state, 12 in the Query, 34 in SQL Execution, 4 in SQL Connect, and 16 in the Other state. As the test progresses, we would expect to see the number of scripts in each state change. The displayed output would be typical of a test execution that is executing normally and is in the middle of the execution. However, if during test execution, test scripts remain in one state or are not showing changes, this could indicate a problem with the test execution or the need to implement or evaluate other performance measures.
Response Time / Throughput
Reports 
Response time / Throughput reports, as their name implies measures and calculates the performance behaviors related to time and / or throughput (number of transactions processed). Typically these reports are displayed as a graph with response time (or number of transactions) on the "y" axis and events on the "x" axis.
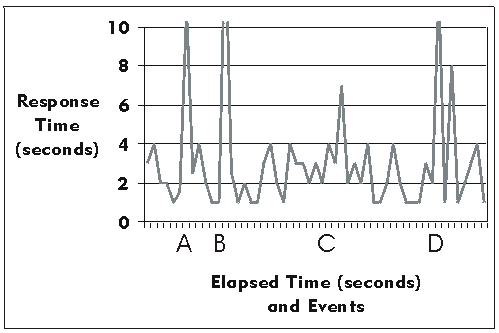
In addition to showing the actual performance behaviors, it is often valuable to calculate and display statistical information such as the mean and standard deviation of the data values.
Percentile Reports 
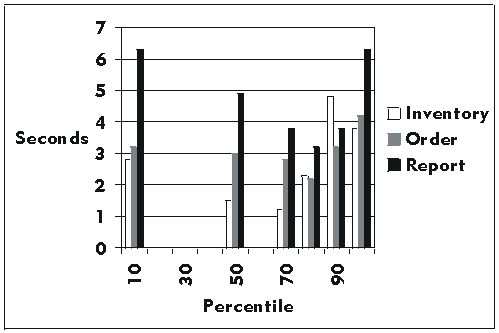
Percentile reports provide another statistical calculation of performance by displaying population percentile values for data types collected.
Comparison Reports 
It is highly desirable to compare the results of one performance test execution with that of another, to evaluate the impact of changes made between test executions the on the performance behaviors. Comparison reports should be used to display the difference between two sets of data (each representing different test executions) or trends between many executions of test.
Trace and Profile
Reports 
When performance behaviors are
acceptable, or performance monitoring indicates the possible bottlenecks (such
as when test scripts remain in a given state for exceedingly long periods) trace
reporting may be the most valuable report. Trace and Profile reports display
lower level information. This information includes the messages between the
actor and the target-of-test, execution flow, data access, and the
function and system calls.