home
***
CD-ROM
|
disk
|
FTP
|
other
***
search
/
Cancer - Principles & Practice of Oncology
/
Oncology.iso
/
PPO
/
CHAP20
/
T1_8.GIF
< prev
next >
Tile
Graphics Interchange Format
|
1999-06-07
|
97.8 KB
|
699x405
|
8-bit (240 colors)
ocr:
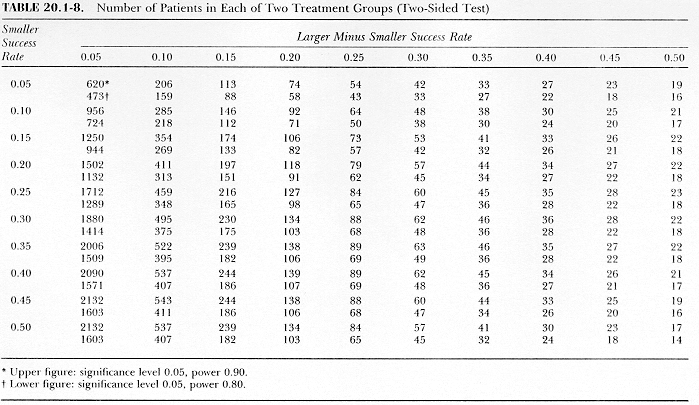
TABLE 20.1-8. Number of Patients in Each of Iwo Treatment Groups (Iwo-Sided Test) Smaller Success Larger Minus Smaller Success Rate Rate 0.05 0.10 0.15 0.20 0.25 0.30 0.35 0.40 0.45 0.50 0.05 620* 206 113 74 54 42 33 27 23 19 4731 159 88 58 43 33 27 22 18 16 0.10 956 285 146 92 64 48 38 30 25 21 724 218 112 71 50 38 30 24 20 17 0.15 1250 354 174 106 73 53 41 33 26 22 944 269 133 82 57 42 32 26 21 18 0.20 1502 411 197 118 79 57 44 34 27 22 1132 313 151 91 62 45 34 27 22 18 0.25 1712 159 216 127 84 60 45 35 28 23 1289 348 165 98 65 47 36 28 22 18 0.30 1880 495 230 134 88 62 46 36 28 22 1414 375 ...